Expert perspectives on the evolution of retina practice, procedures, technologies and instrumentation.
Michael F. Marmor, MD
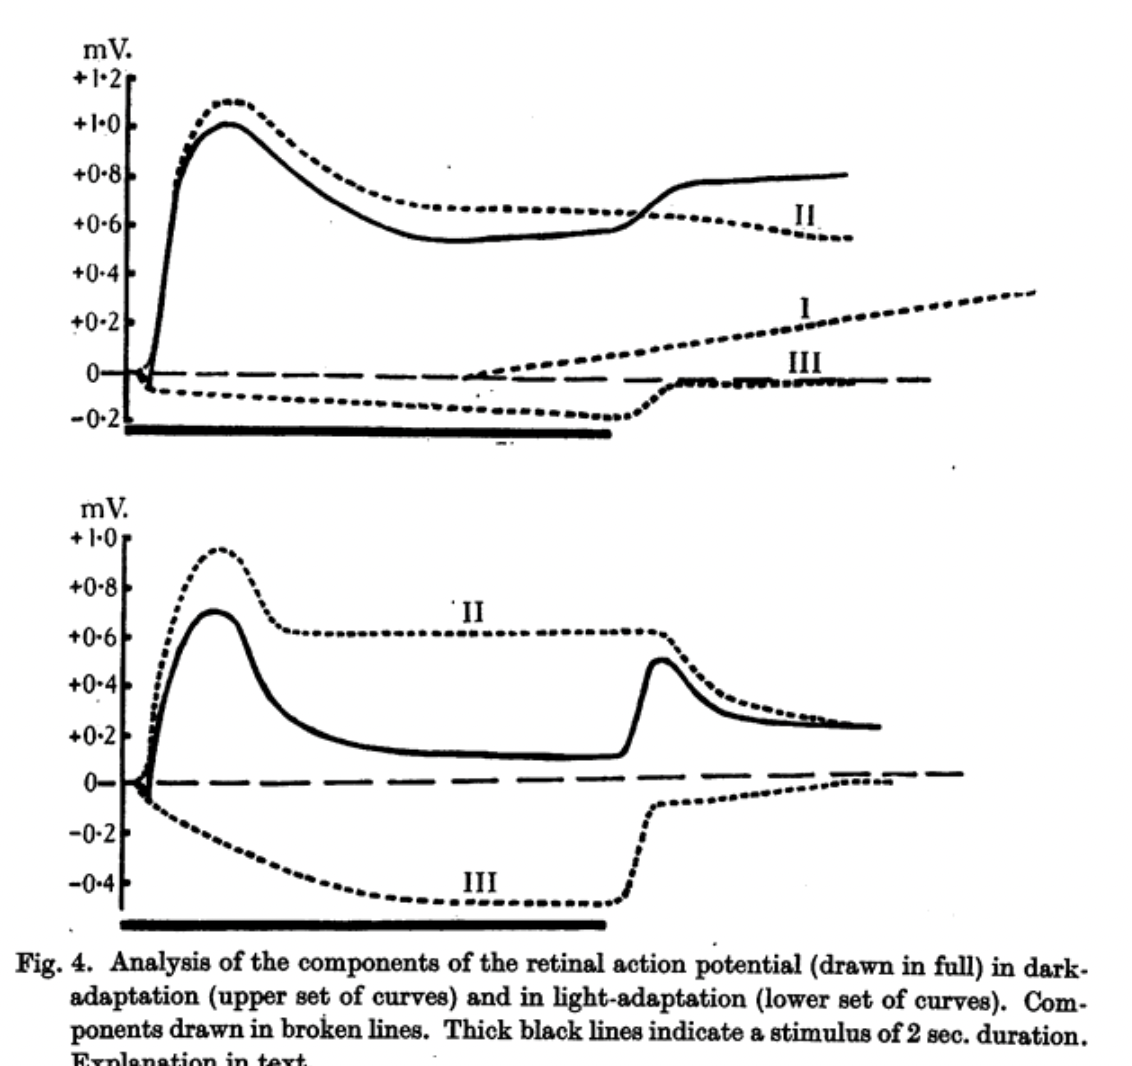
Retinal electrical signals to light were first recognized in 1865 by the Swedish physiologist Holmgren in the isolated frog eye; and in 1873, the Scottish chemist James Dewar teamed with physiologist John McKendrick to demonstrate a retinal response in animal eyes and humans.[1] Better electrodes and galvanometers helped Einthoven and Jolly in 1908 to identify an initial negative a wave, followed by a positive b wave, in the frog light response.[2] Granit’s careful studies in the 1930s led to an analysis of these overlapping electrical processes (Figure 1) and won him the 1967 Nobel Prize in Physiology or Medicine.[3] However, the electroretinogram (ERG) remained impractical for patient use until the late 1940s, when contact lens electrodes or saline baths allowed Riggs, Karpe, and Adrian to make clinical recordings.
The steady improvement in lenses—particularly the Burian Allen hard contact lens electrode in the 1960s—made the ERG feasible as a diagnostic tool. Van der Tweel published guidelines for recording technology in 1961, but did not address physiologic factors such as adaptation time and flash characteristics. Peter Gouras and Eliot Berson at the National Institutes of Health in the late 1960s showed how controlling adaptation and light stimuli could produce consistent ERG waveforms.[4] But even by the 1980s, reports in the literature still came from labs using a wide variety of adaptation conditions, flash intensities, stimulation frequencies, and colors. As a result, ERG data could not be compared between different labs or diseases, and consensus was sorely needed on how to stimulate the eye in a consistent manner.
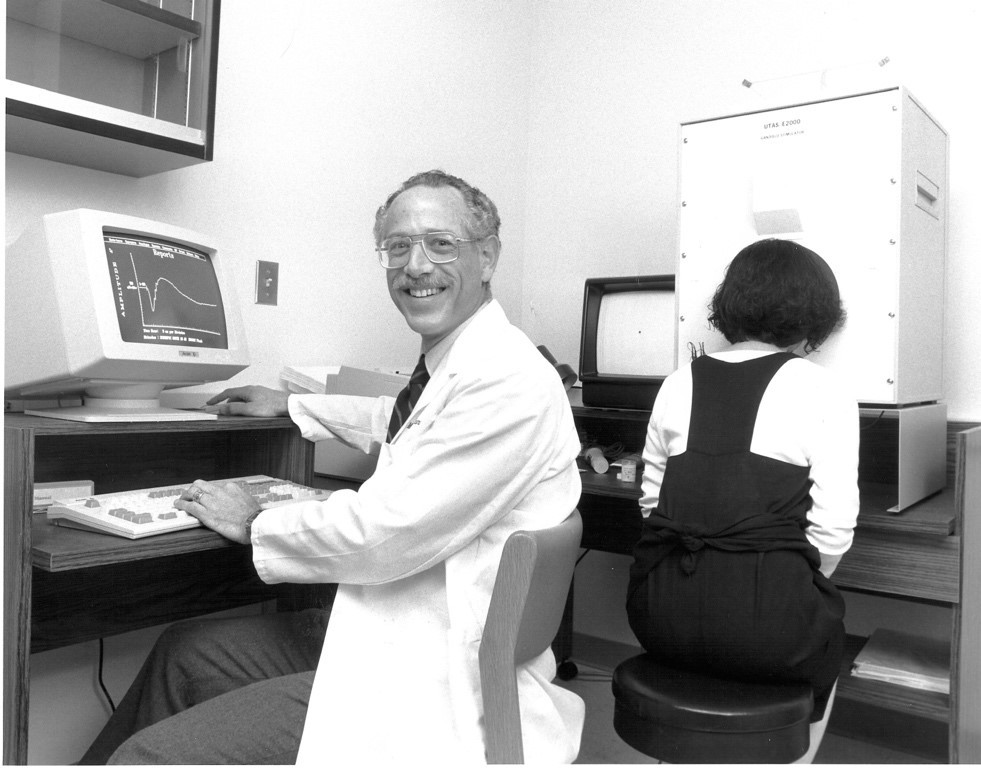
In the late 1980s, the National Retinitis Pigmentosa Foundation (NRPF, now renamed the Foundation Fighting Blindness) sought to define a set of standard conditions for recording the ERG to facilitate clinical trials on dystrophies that they hoped to establish. The idea was not unreasonable, except that the Foundation was only one organization in the United States— leaving a world of ERG usage and publications that could not be universally interpreted. One of the Foundation’s board members, Michael F. Marmor, MD (Figure 2), argued that standardization would be better achieved, and more widely accepted, if it came from a global organization such as the International Society for the Clinical Electrophysiology of Vision (ISCEV), to which he also belonged. The NRPF was hesitant to relinquish its quest, but agreed to let ISCEV try—as long as it didn’t take too long.
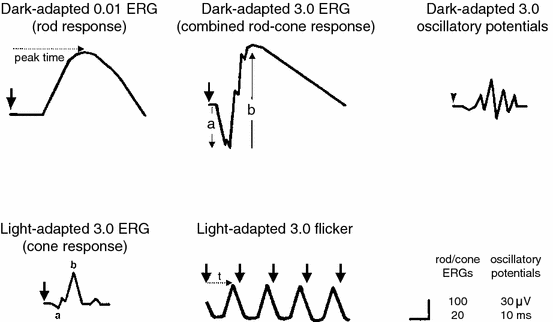
The initial ISCEV members on the standardization committee included Marmor (also for the NRPF), Geoff Arden (also for the International Council of Ophthalmology), Sven-Erik Nilsson, and Eberhart Zrenner; together, they scoured the ERG literature to define guidelines for equipment and light stimulation that would produce a core set of physiologically meaningful and reproducible responses. They were aware that a standard had to use available equipment, and that the recording conditions had to be achievable in clinics everywhere. The ISCEV Standard for Clinical Electroretinography was finally approved and published in 1989.[5] These protocols gave practical information about how to assess rod, cone, and bipolar cell function with comparable waveforms, and they were soon adopted worldwide (Figure 3). The NRPF happily used them for planning clinical studies.
It is important to recognize that the “standard ERG” is a global response, produced by stimulation of the entire retina (usually by a full-field dome or diffusing lens), and as such, it does not recognize focal damage including macular disease. With a dark-adapted eye, the weak-flash response represents rods and the strong-flash response represents a mix of rods and cones. The initial negative a wave basically represents photoreceptors, while the slower positive b wave represents bipolar cells (Figure 3). With a light-adapted eye, the strong-flash response comes entirely from cones, but is still little affected by macular disease because most of the retina is extramacular. Thus, the ERG is primarily useful to assess the extent and nature of diffuse retinal diseases.
To address the question of macular function, Erich Sutter in the 1990s developed the multifocal ERG (mfERG). Instead of using a full-field stimulus, patients look at a computer screen that is typically divided into 61 to 103 pixels covering the posterior pole; these pixels switch between light or dark according to a mathematical sequence. The overall ERG response from each switch can then be analyzed by a computer to reveal the effective signal from each pixel, giving a map of local ERG responses within the macula and sometimes beyond.[6] The mfERG has also been standardized by ISCEV.[7]
The ERG and mfERG are used widely to assess retinal status within and beyond the macula, although labs are mostly in academic centers or large retina practices. There can be a considerable range of normative values, but significant loss is usually obvious. The technology for these tests is improving continually, with a wide range of comfortable electrodes (foils, conductive fibers, and even disposable soft lenses), and recording without touching the eye can be done with skin electrodes and averaging. Simplified handheld devices are on the market. The ISCEV standards for both full-field ERG and mfERG are updated roughly every 5 years, and current versions are freely available on the ISCEV website. The key fact: the ERG is the only objective measure of retinal function, as opposed to subjective tests or anatomical changes. Despite the growing sophistication of retinal imaging, there are times when it is important to know whether a retina actually works!
References
1. Dewar J, McKendrick JG. The physiological action of light. Nature. 1877;15:433-435. doi:10.1038/015433a0
2. Einthoven W, Jolly WA. The form and magnitude of the electrical response of the eye to stimulation by light at various intensities. Q J Exp Physiol. 1908;1(4):373-416. doi:10.1113/expphysiol.1908.sp000026
3. Granit R. The electrical responses of light- and dark-adapted frogs’ eyes to rhythmic and continuous stimuli. J Physiol. 1934;81:1-28.
4. Berson EL, Gouras P, Hoff M. Temporal aspects of the electroretinogram. Arch Ophthalmol. 1969;81(2):207-214. doi:10.1001/archopht.1969.00990010209011
5. Marmor MF, Arden GB, Nilsson SEG, Zrenner E. Standard for clinical electroretinography: International Standardization Committee. Arch Ophthalmol. 1989;107(6):816-819. doi:10.1001/archopht.1989.01070010838024
6. Sutter EE, Tran D. The field topography of ERG components in man—I. The photopic luminance response. Vis Res. 1992;32(3):433-446. doi:10.1016/0042-6989(92)90235-b
7. Marmor MF, Hood D, Keating D, Kondo M, Seeliger MW, Miyake Y. Guidelines for basic multifocal electroretinography (mfERG). Doc Ophthalmol. 2003;106(2):105-115. doi:10.1023/a:1022591317907
(Milestone essay published 2025)